Thoughts on JavaScript, AngularJS, and more
- Daily score sums…
- …rolled up into weekly score sums
-
The formula returns an error for future weeks that haven’t been calculated yet.
-
A particular oddity with Google Spreadsheets was causing the VLOOKUP to lock the formula in place and make it uneditable (turns out this is a Google Spreadsheets bug when doing a VLOOKUP on pivot tables – hopefully this gets fixed soon).
- Making sure commandline tools was installed
- Making sure RubyGems was up to date with
sudo gem update --system
Using Google Spreadsheets (or Excel) to Chart Your Success Through Life
08 May 2014This post originally appeared in my other blog, Living For Improvement. However, given the technical nature of the lifehack at hand, I decided to cross-post it here. Enjoy!
For years now, I’ve been using a system called Key Lifestyle Indicators (KLIs) that I modeled after the idea of Key Performance Indicators in business.
My KLI definitions have changed over the years; here’s my current set-up:
This system works very well for me, consistently reminding me where I’m slacking and where I’m succeeding. The best part: it requires less than 10 seconds per day to enter the necessary information (nowadays it’s simply 1s and 0s transformed into a moving average).
It wasn’t until this past week that I found a way to leverage this tracked data in a new, interesting way. The inspiration came from reading Wait But Why’s post on what your life looks like plotted out into weeks (hint: You have less than 4,500 weeks in your life to spend – how have you been using them?).
I loved the idea of a meaningful reminder of the limited number of weeks we have on this planet. Thankfully, Wait But Why offers some sweet calendars that allow you to track how you’re living out your weeks – either with hand-scribbled notes or via color coding.
I’ll probably pick up one of these awesome calendars some time in the near future, but I wondered if I could use my years of KLI data to graphically represent this without needing to create yet another place to track my progress through life.
This post describes how I took my KLI data and created a Wait-But-Why-styled life calendar that lives in Google Spreadsheets (or Excel, if that’s your thing). If you track similar data in a spreadsheet, this article should help you in creating a similar set-up (read Wait But Why’s post for a deeper understanding of why a life calendar is awesome).
Step 1: Prototype the end result
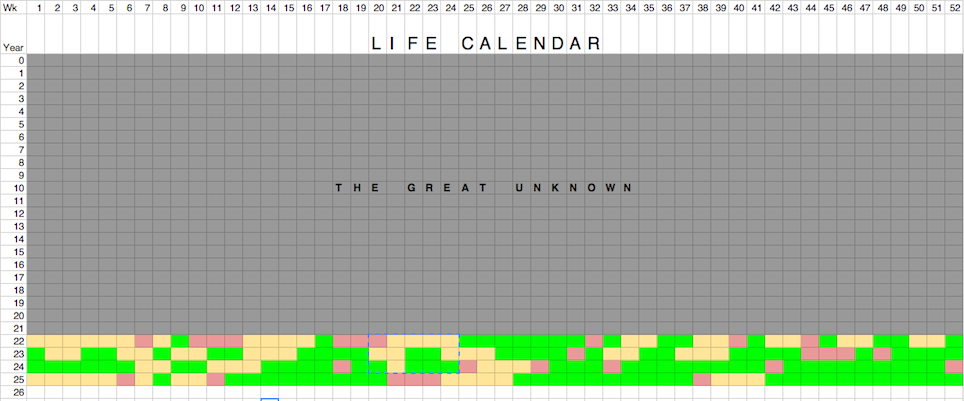
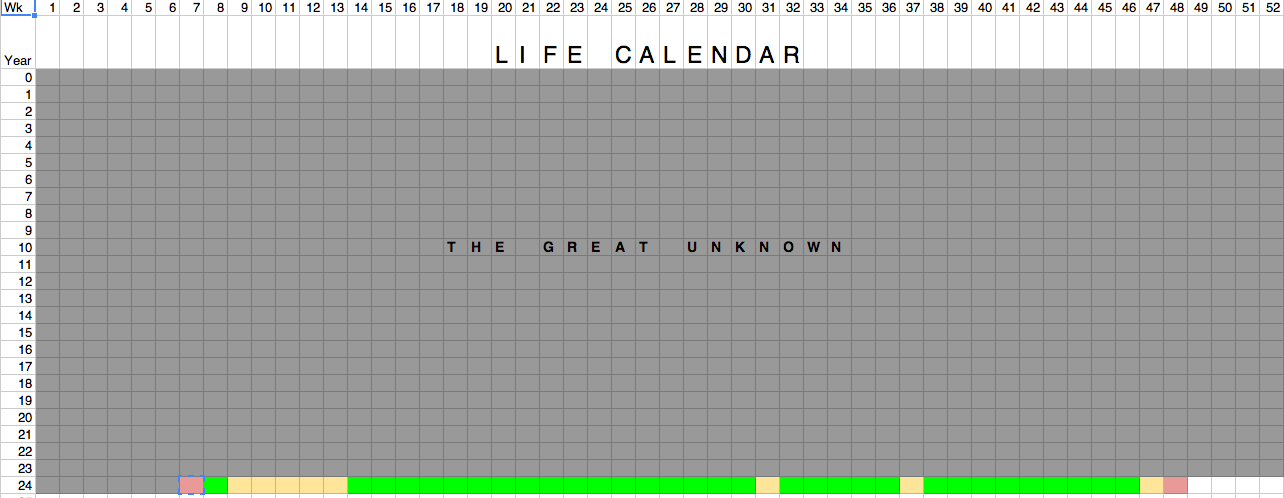
Here’s what I wanted my life calendar to look like when all was said and done:
Note how I keep untracked weeks in gray, but everything else is colored yellow, green, or red depending on how my KLIs looked that week. The goal was to have this automatically calculated for me, as manually-inputted tracking can get quite annoying. But in order for this to become automated, I needed to pull together all of the necessary data, which brings me to step 2…
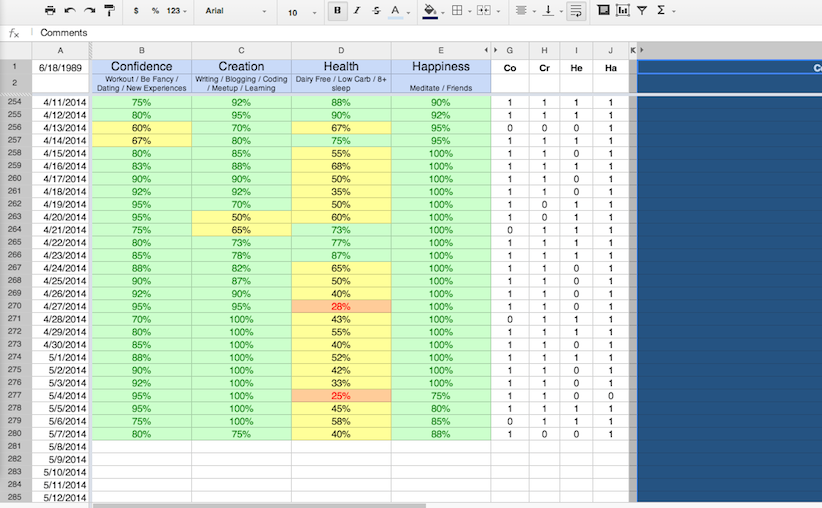
Step 2: Survey the current datascape
The calendar prototype looked good, but the data I needed was siloed in different cells. In other words, because none of the data was rolled up by day or week, some intermediary data compilation was required before the calendar could pull what it needed.
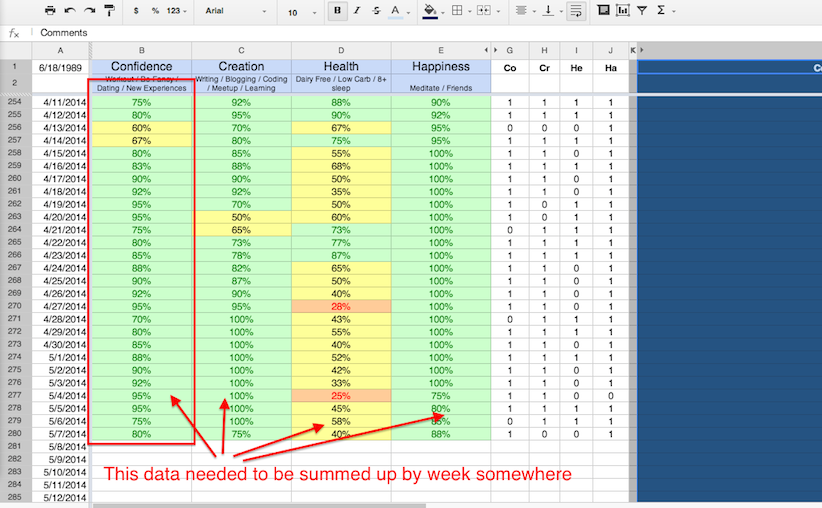
Step 3: Compile the calendar data
After surveying my data, I realized I needed to compile my data in two ways to transition to the life calendar:
I ended up adding two additional columns into my KLI sheet (which I now keep hidden) to accomplish step 1. See below:
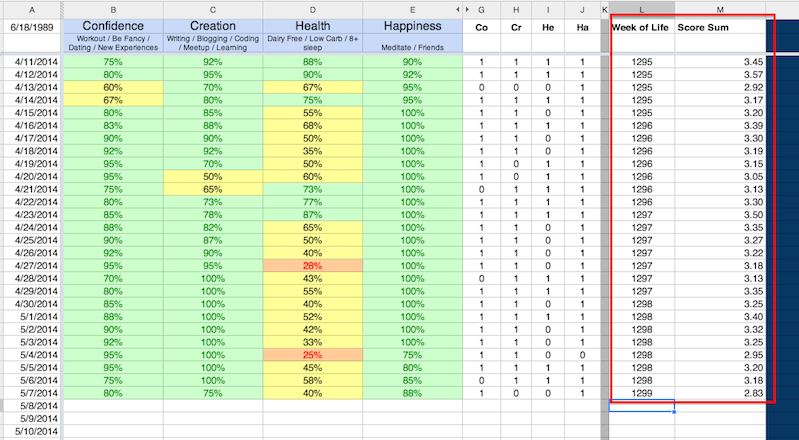
I calculated the week of my life (Column L) using this formula: =ROUNDDOWN((CURRENT_DATE - DATE_I_WAS_BORN +1)/7). The +1 in that formula ensures that the calculation includes today’s date when rounding down to the current week.
From there, I summed up each day’s scores using the sum of columns B, C, D, and E. For example, for the day on row 50, the M50 cell contained =B50+C50+D50+E50.
For step 2, I used a pivot table to keep an up-to-date weekly summary of my scores:
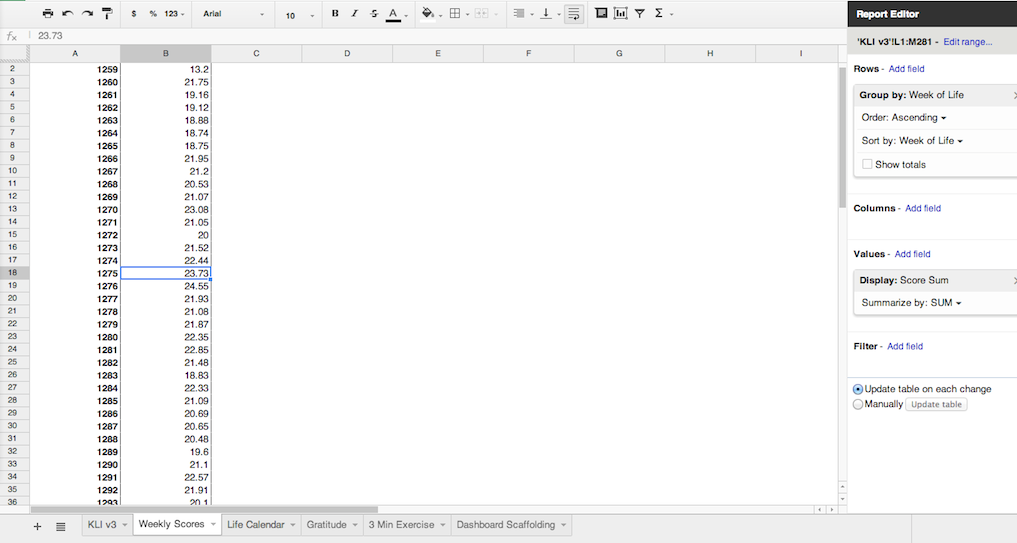
It rolls up all of the scores by week using the two new columns I showed in the previous screenshot. With my daily scores summed and rolled up by week, it was time to link this data to my calendar prototype.
Step 4: Bring the calendar to life
This step was the most time intensive, so I broke into three main tasks:
A. Link the data points to the calendar
This task involved a VLOOKUP formula to pull the right score based on week. To pull from the right place in the pivot table, I simply needed to calculate the current week and then do the VLOOKUP. It’s a little heavy to look at, but it ended up looking like this: =VLOOKUP(rounddown((CURRENT_YEAR*365)/7 + WEEK_INDEX+1),'Weekly Scores'!$A:$B,2, False)
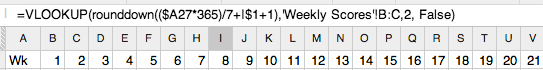
Here’s a broader view with cell highlighting. Notice how it uses the Week Index and the current year to calculate the correct week of my life, and then runs the VLOOKUP based on that value:
B. Handle errors
Although the VLOOKUP worked quite well, there were two errors I had to account for:
To solve the first issue, it was rather easy. I wrapped the VLOOKUP in an IFERROR like so:
=IFERROR(VLOOKUP_GOES_HERE, "")
This made sure that the formula returned an empty string for future weeks, keeping the calendar clean and error-free.
To solve the second issue, I used a trick I found on Stack Exchange. The trick involves arbitrarily adding a +0 to your VLOOKUP calculation. This won’t skew the calculation, obviously, and for some reason keeps the cell formula editable.
Here’s what the VLOOKUP looked like with the +0 added in:
VLOOKUP(rounddown((CURRENT_YEAR*365)/7 + WEEK_INDEX+1),'Weekly Scores'!$A:$B,2, False)+0
Problem solved!
With both errors handled, the final formula looked like this:
=IFERROR(VLOOKUP(rounddown((CURRENT_YEAR*365)/7 + WEEK_INDEX+1),'Weekly Scores'!$A:$B,2, False)+0, "")
C. Set up conditional formatting rules
With the hard part out of the way, all I needed to do was make the cells color coded based on my score that week.
In my KLI system, the ideal day would earn me 4 points. Therefore, my ideal week would yield 28 points. With that in mind, here’s how I defined and color-coded great, ok, and bad weeks.
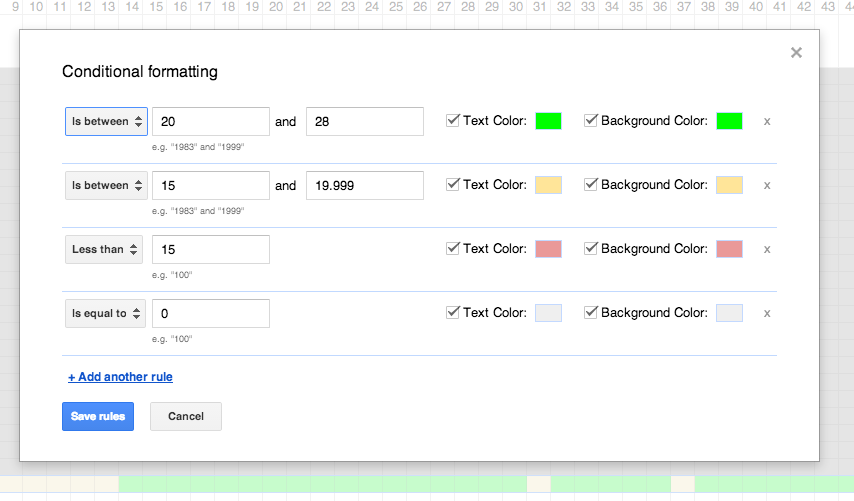
As you can see, 20 points or above is a good week, 15-20 points is a so-so week, and anything less is a red flag. Also notice how I alter the text color as well to hide the number calculation that lives in the cell.
Step 5: Celebrate!
At this point, I took a step back and appreciated my sexy, new life calendar, auto-calculated based on the KLI system I’ve trusted for years.
Tim Urban, if you’re reading this post, I just want to say thank you for the inspiration. I follow your blog religiously, and this obviously could not have come about without your wisdom. Cheers mate.
Now, off to appreciate the precious weeks I have left.
Preventing MySQL from Randomly Stopping on Ubuntu 12.04
05 May 2014I recently migrated my WordPress blog from GoDaddy to Digital Ocean. Digital Ocean is a fantastic way to set up your own server at low cost, but it does require you to do a lot of the maintenance work yourself.
I was able to follow Digital Ocean’s guide for migrating my previously existing WordPress blog, LivingForImprovement.com, from GoDaddy to Digital Ocean, but one pain point I couldn’t resolve was MySQL randomly terminating itself due to low memory on my Digital Ocean droplet. Without MySQL running, blog posts couldn’t be fetched when people visited my blog. No bueno :(.
I made sure a swap file was active on my droplet, but every week or so, MySQL would still terminate itself. Working with memcache also seemed like a viable option, but it looked a little bit over my head. While I do plan to learn memcache eventually, I decided to get my toes wet in the world of shell scripting to help manage the problem until I do.
It’s nothing special, but here’s what I did:
Step 1 - Create a simple shell script
sudo nano /usr/local/sbin/mysql_check.sh
Then, I wrote the following:
#!/bin/bash
if [[ ! "$(service mysql status)" =~ "start/running" ]]
then
    service mysql start
    # echo "Restarting MySql" # Uncomment for debugging
else
    # echo "Looks like MySql is running. No action taken" # Uncomment for debugging
fi
Finally, make sure your script is executable:
sudo chmod +x /usr/local/sbin/mysql_check.sh
Step 2 - Set up a cron job to check MySQL’s status every minute
Until I sit down and learn the ins and outs of memcache, I’d prefer that this cron check every minute to make sure MySQL is running. I had to do this in root’s crontab, since the commands I’d need the script to run require root.
sudo crontab -e
And within your root crontab:
PATH=/usr/sbin:/usr/bin:/sbin:/bin
*/1 * * * * /usr/local/sbin/mysql_check.sh >> /home/jon/cronlog.log 2>&1
I had to add the PATH variable to the script to allow crontab to run the commands in my shell script, such as service mysql start as per this article’s discussion.
Just for debugging purposes, I’m routing any output to a log file in my home directory, just to initially measure how often the cron needs to restart MySQL. If you’re not curious about this, you can change the above to:
PATH=/usr/sbin:/usr/bin:/sbin:/bin
*/1 * * * * /usr/local/sbin/mysql_check.sh
Step 3 - Improvement
I realize that this isn’t the most elegant solution, but it works for now, until I have the bandwidth to learn to use memcache like a boss. Any suggestions / feedback? Leave it in the comments section below. :)
A Better Way to Integrate AngularJS and Google Charts
05 Apr 2014
Last Updated: 4/12/2014
I’m fairly new to the world of web development (I started coding a year and half ago), and one of my favorite discoveries thus far is AngularJS.
As with many people new to Angular, the hardest concept to grok was that of directives. Whenever you’d like to manipulate the dom in some way, a directive is how you do it. Additionally, directives (along with services) are a great way to integrate third party libraries and APIs with Angular.
I’ve recently been working on a small meditation timer app and was having some trouble integrating the Google Charts / Visualization API with AngularJS. I found a solid starting point with Gavin Draper’s article on how he did it.
His code samples were fantastic for getting me up and running. But as I continued to work on the application, I found a few disadvantages with that implementation, and figured it never hurts to improve on the great content of others. Here are a few areas I wanted to work on:
Bootstrapping Angular
google.setOnLoadCallback(function () {
    angular.bootstrap(document.body, ['my-app']);
});
google.load('visualization', '1', {packages: ['corechart']});
This is the code used to initialize the Angular application in Gavin’s post. The given code here works just fine, but I noticed that Angular’s bootstrap function only runs once the Google Loader fires off the callback function.
By requiring the Google Loader callback to fire before bootstrapping the Angular application, if the Google Loader ever falters, the app simply won’t run. That felt like an unacceptable trade-off.
A better approach would be to wrap the Googe Loader in an Angular Service, which I’ll explain how I did later in this post.
Nested models
googleChart.directive("googleChart",function(){
    return{
        restrict : "A",
        link: function($scope, $elem, $attr){
            var dt = $scope[$attr.ngModel].dataTable;

            var options = {};
            if($scope[$attr.ngModel].title)
                options.title = $scope[$attr.ngModel].title;

            var googleChart = new google.visualization[$attr.googleChart]($elem[0]);
            googleChart.draw(dt,options)
        }
    }
});
The directive used in Gavin’s article wasn’t utilizing Angular’s useful $scope.$eval for reading attributes. Rather, it was passing the ngModel attribute directly to the $scope object. If you had a nested model – a best practice in many situations – such as $scope.chartModel.dataset1, the directive would break by trying to do something like this var dt = $scope['chartModel.dataset1'].dataTable;
As I mentioned, a better approach would be to use $scope.$eval, which will safely eval the attribute to give you access to the necessary model.
Unit Testing
The only other concern I had was, by calling google.load in the global scope, unit testing became more difficult. My Karma / Jasmine setup was failing because the google namespace wasn’t defined in the test environment when injecting my Angular app module.
Again, the way to avoid this problem is to keep the google namespace wrapped in an Angular Service so that it can be mocked and/or ignored in my various unit tests.
A Better Solution
Given the drawbacks listed above, here’s how I ended up implementing Google Charts. I consider this to be a more ‘Angular’ way to do it, by relying more heavily on Angular services, watchers, and keeping the Google Loader in a nicely contained environment.
Let’s start with the DOM and the controller:
DOM:
<!DOCTYPE html>
<html lang="en" ng-app="myApp">
    <head>
         <script src="https://ajax.googleapis.com/ajax/libs/angularjs/1.2.15/angular.min.js"></script>
         <script src="https://www.google.com/jsapi" type="text/javascript"></script>
         <!-- Place additional scripts for controller, directives, etc. here -->
    </head>
    <body ng-controller="ChartCtrl">
        <div google-chart="ColumnChart" ng-model="dataModel.visual" trigger="activateChart"></div>
    </body>
</html>
Note that $scope.activateChart is going to be the trigger to build the chart.
Controller:
var app = app || angular.module('myApp', []);

app.controller('ChartCtrl', function($scope, ChartService) {

    // activateChart flips to true once the Google
    // Loader callback fires
    $scope.activateChart = false;

    // This is where my data model will be stored.
    // "visual" will contain the chart's datatable
    $scope.dataModel = {
        visual: {},
        metaData: {},
        data: {}
    };

    // First, we attempt to load the Visualization module
    var loadGoogle = ChartService.loadGoogleVisualization();

    // If the Google Loader request was made with no errors,
    // register a callback, and construct the chart data
    // model within the callback function
    if (loadGoogle) {

        google.setOnLoadCallback(function() {

            $scope.dataModel.visual.dataTable = new google.visualization.DataTable();

            // Set up the dataTable and columns
            var dataTable = $scope.dataModel.visual.dataTable;
            dataTable.addColumn("string","Date")
            dataTable.addColumn("number","Minutes")

            // Populate row data
            dataTable.addRow(["3/1/14",5]);
            dataTable.addRow(["3/2/14",13]);

            // Update the model to activate the chart on the DOM
            // Note the use of $scope.$apply since we're in the
            // Google Loader callback.
            $scope.$apply(function(){
                $scope.activateChart = true;
            });
        });
    }
});
Next, let’s look at the Angular Service. I chose to place google.load() in a try/catch block to guard against any errors that might spring up if any breaking changes are introduced in the future.
There’s also a quirk in the Google Loader worth noting: If you want to load an API after the page renders, you need to add an arbitrary callback, otherwise the loader will use document.write(), which will overwrite all of the HTML on the page.
app.factory('ChartService', function() {
    return {

        /**
         * Loads the visualization module from the Google Charts API
         * if available
         * @returns {boolean} - Returns true is successful, or false
         * if not available
         */
        loadGoogleVisualization: function() {

            // Using a try/catch block to guard against unanticipated
            // errors when loading the visualization lib
            try {

                // Arbitrary callback required in google.load() to
                // support loading after initial page rendering
                google.load('visualization', '1', {
                    'callback':'console.log(\'success\');',
                    'packages':['corechart']
                });

                return true;

            } catch(e) {
                console.log('Could not load Google lib', e);
                return false;
            }

        }
    };
});
And finally, let’s take a look at the underlying directive.
Directive:
app.directive("googleChart",function(){
    return{
        restrict : "A",
        link: function($scope, $elem, $attr){
            var model;

            // Function to run when the trigger is activated
            var initChart = function() {

                // Run $eval on the $scope model passed
                // as an HTML attribute
                model = $scope.$eval($attr.ngModel);

                // If the model is defined on the scope,
                // grab the dataTable that was set up
                // during the Google Loader callback
                // function, and draw the chart
                if (model) {
                    var dt = model.dataTable,
                        options = {},
                        chartType = $attr.googleChart;

                    if (model.title) {
                        options.title = model.title;
                    }

                    var googleChart = new google.visualization[chartType]($elem[0]);
                    googleChart.draw(dt,options)
                }
            };

            // Watch the scope value placed on the trigger attribute
            // if it ever flips to true, activate the chart
            $scope.$watch($attr.trigger, function(val){
                if (val === true) {
                    initChart();
                }
            });

        }
    }
});
And there you have it! Google Visualization Charts right in your Angular application without any worries of Google Loader failure, unit testing difficulties, or data model restrictions.
Granted, I’m still a beginner to AngularJS (I’ve only been writing Angular apps for 7-8 months now), so if you see any faults here, definitely point it out in the comments below! For starters, it probably would’ve made more sense to register the Google Loader callback in the service, rather than the controller. Comment if you agree!
-Jon
Installing Jekyll on OS X 10.9.2
04 Apr 2014Ironically, as I was trying to install Jekyll to set up this blog on Github, I ran into a lot of problems. The command-line error wasn’t too helpful but it looked something like this:
Building native extensions.  This could take a while...
ERROR:  Error installing jekyll:
	ERROR: Failed to build gem native extension.

    /System/Library/Frameworks/Ruby.framework/Versions/2.0/usr/bin/ruby extconf.rb
creating Makefile

make "DESTDIR=" clean

make "DESTDIR="
compiling porter.c
porter.c:359:27: warning: '&&' within '||' [-Wlogical-op-parentheses]
      if (a > 1 || a == 1 && !cvc(z, z->k - 1)) z->k--;
                ~~ ~~~~~~~^~~~~~~~~~~~~~~~~~~~
porter.c:359:27: note: place parentheses around the '&&' expression to silence this warning
      if (a > 1 || a == 1 && !cvc(z, z->k - 1)) z->k--;
                          ^
                   (                          )
1 warning generated.
compiling porter_wrap.c
linking shared-object stemmer.bundle
clang: error: unknown argument: '-multiply_definedsuppress' [-Wunused-command-line-argument-hard-error-in-future]
clang: note: this will be a hard error (cannot be downgraded to a warning) in the future
make: *** [stemmer.bundle] Error 1

make failed, exit code 2

Gem files will remain installed in /Library/Ruby/Gems/2.0.0/gems/fast-stemmer-1.0.2 for inspection.
Results logged to /Library/Ruby/Gems/2.0.0/extensions/universal-darwin-13/2.0.0/fast-stemmer-1.0.2/gem_make.out
Both the Jekyll troubleshooting page and StackOverflow recommended two ways to resolve installation issues:
However, neither of these did the trick for me. Thankfully, after an hour of searching, I ended up finding the right clues here.
As per the StackOverflow link above, I installed Homebrew and RVM, using this guide; this did the trick. Success!
While I do wonder why RVM / Homebrew was necessary, it seems to be working for others as well. Thought I’d call it out for any others struggling out there, as I had difficulty finding the right clues on Stack Overflow.